
A 5000 IU vitamin D3 softgel is 125 mcg of vitamin D. If your tracker only counts food, that 125 mcg never reaches the vitamin D row, and the app reads you as if you took nothing.
A 5000 IU vitamin D3 softgel is 125 mcg of vitamin D. If your tracker only counts food, that 125 mcg never reaches the vitamin D row, and the app reads you as if you took nothing. If you're keeping track of your supplements and not food, you may inadvertently be consuming harmful levels.
The short version of how to track micros: log everything you eat and every supplement you take, let a tracker total each vitamin and mineral for the day, and compare those totals to a target that fits you. The rest of this guide covers what that target should be, which free tools do the job, and where the numbers mislead.
What does tracking micros mean, and what does a micronutrient tracker do?
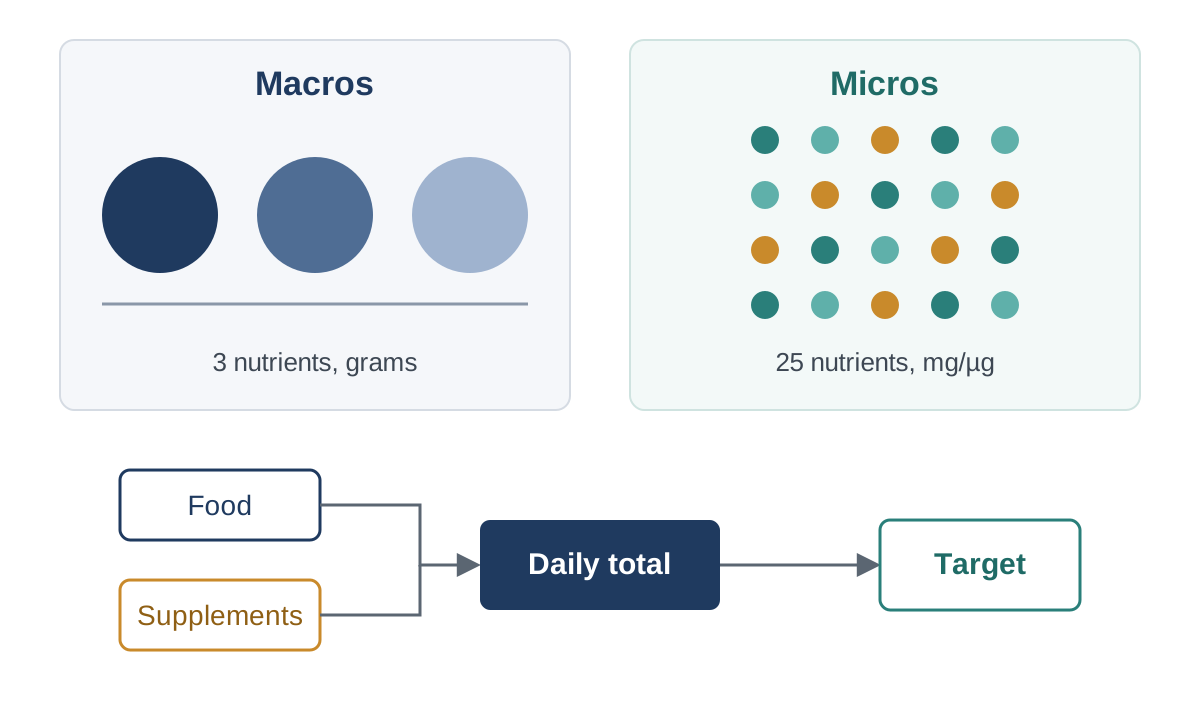
Macros are protein, carbohydrate and fat, counted in grams and adding up to your energy intake. Micros are the vitamins and minerals, counted in milligrams or micrograms, and there are many more of them to follow. Micros, for example, tracks 25: calcium, iron, magnesium, phosphorus, potassium, sodium, zinc, copper, manganese, selenium, iodine, vitamins A, C, D, E and K, thiamin, riboflavin, niacin, pantothenic acid, B6, folate, B12, choline and omega-3.
The "total" step is where most trackers lose accuracy. A tracker logs food and supplements, adds up each nutrient for the day and compares the result to a target. If it only counts food, every nutrient you supplement reads lower than what you actually take in, as in the vitamin D case above. It is also why hitting 100% of the RDA on a food-only app for a single day tells you less than the green bar suggests: the total leaves out supplements, and one day is a noisy sample.
Is the RDA your personal target? What RDA, EAR, AI and UL mean
Your tracker compares totals to a reference value. In the US and Canada those values come from the Dietary Reference Intakes (DRIs). The DRIs replaced the older single-number RDAs after a 1993 Food and Nutrition Board/IOM symposium. The new framework added chronic disease risk reduction and, where toxicity data existed, upper levels (PMID 15883451).
Value | What it is | Data basis | Used for |
|---|---|---|---|
EAR (Estimated Average Requirement) | Intake at which the needs of 50% of people consuming it will not be met | Requirement data for an age and sex group | Assessing intakes against the median requirement |
RDA (Recommended Dietary Allowance) | A goal for the individual | Derived from the EAR; set to meet the needs of nearly all (97-98%) healthy people in the group (NIH Office of Dietary Supplements) | Planning individual intake |
AI (Adequate Intake) | Level experts judge to meet the needs of all individuals in a group, set when an RDA cannot be | Much less data and more judgment than an EAR or RDA | Planning individual intake when no RDA exists |
UL (Tolerable Upper Intake Level) | Intake that may cause adverse effects if habitually exceeded | Toxicity data, where available | Upper boundary for habitual intake |
Definitions follow the Food and Nutrition Board summary (PMID 9627630). Having four values lets the system separate planning uses from assessment uses (PMID 15883451). The RDA and AI are both written as individual goals, but both are calculated from group data. The AI also carries more expert judgment than the RDA does.
That judgment shows up clearly when you watch a reference value change. Japan's 2020 DRIs set vitamin D as an AI. Earlier versions based it on preventing rickets and osteomalacia, and in 2005 on the median intake of healthy subjects. In 2020 the basis became fracture prevention. The arithmetic was 15 µg/d needed for fracture prevention, minus the 5 µg/d that skin may produce during a Sapporo winter. The authors say more clinical and epidemiological studies are urgently needed (PMID 33390390). The target on your tracker reflects a committee's choice of endpoint, assumptions and data.
The table below lists factors that research links to shifts in individual requirement or status, limited to those with a source in hand.
Factor | Example nutrient | What the research found | Source |
|---|---|---|---|
Age | B12 | Adults over 75 are listed as a B12 risk group | PMID 28925645 |
Childhood | Iron, zinc, B12 | Children have higher nutrient requirements per kg body weight, which raises deficiency risk relative to adults | PMID 31722049 |
Pregnancy | B12 | Pregnant people are listed among low-intake groups for B12 | PMID 36669740 |
Pregnancy | Iron, folate, iodine | US RDAs rise in pregnancy: iron from 18 mg to 27 mg, folate from 400 to 600 mcg DFE, iodine from 150 to 220 mcg | NIH ODS iron, folate and iodine fact sheets |
Iron source (heme vs non-heme) | Iron | The iron RDA for vegetarians is set 1.8 times higher than for people who eat meat, because non-heme iron from plants is absorbed less well than heme iron | |
Nutrient-nutrient interaction | Zinc and copper | High zinc intakes can reduce copper absorption; the zinc UL of 40 mg for adults is based on that effect on copper status | |
Training load | Vitamin D, A, calcium, magnesium, folate | In 19 pre-season professional soccer players, 100% were below the vitamin D EAR, 74% below vitamin A, 68% below calcium and magnesium, and 58% below folate | PMID 29037118 |
Absorption and phytate | Iron, zinc, calcium | Phytate and oxalate reduce bioavailability; soaking, germination and sourdough leavening lower phytate in pulses and cereals | PMID 29174030 |
Diet pattern | B12, iron, zinc, DHA | The paper states a reliable B12 source (fortified foods or supplements) is needed; high phytate and fibre intake can raise iron deficiency prevalence despite high vitamin C intake; mean DHA intake is lower in vegetarians | PMID 29174030, PMID 31722049 |
Medications | B12 | Metformin use over 4 months and PPI or H2 blocker use over 12 months are listed as risk factors | PMID 28925645 |
The list is not complete. Sweat losses, nutrient form, genetics and body size are also studied as sources of individual variation, and the USDA's own DRI calculator notes that individual requirements may be higher or lower than the DRIs.
Most of these rows work as brief lookups. Two carry more weight and deserve a closer read, and both come with caveats. The training-load row is an intake finding: the soccer players were compared against EARs using a 3-day food record, with no biomarkers, so it shows where intake landed, not what their status was (PMID 29037118). The German pediatric paper also flags confounding in the diet-pattern row: vegetarians often have higher socioeconomic status and healthier lifestyles, which complicates comparisons between diet groups (PMID 31722049).
The medication row is the second, and the evidence is less settled than a table row makes it look. A meta-analysis of 25 studies (2852 PPI users, 28070 non-users) found a pooled odds ratio for B12 deficiency of 1.42 (95% CI 1.16-1.73) with I² = 54%. Most included studies found no difference in serum B12. The authors judged the OR too low, and the heterogeneity too high, to clearly imply an association (PMID 37060552). For metformin, the proposed mechanism is interference with calcium-dependent binding of the intrinsic factor–B12 complex in the terminal ileum. That mechanism is proposed and has not been established. One review estimates liver stores would probably be depleted after more than 5 years of use (PMID 35491956). Given evidence this mixed, logging your medications next to your intake gives you and a clinician more to work with than a list of risks does.
What are the free ways to track micros?
Tool | What it does | Food database | Supplements counted in totals | Main limit |
|---|---|---|---|---|
Cronometer (free tier) | Food logging with vitamin and mineral totals against targets | Lab-analyzed sources such as USDA and NCCDB, plus staff-verified entries | Yes, if you log them | Some features like photo logging and historical data sit behind Gold ($10.99/mo) |
USDA FoodData Central + spreadsheet | Look up nutrient values per food and total them yourself | USDA FoodData Central | Only if you add rows by hand | Manual work; nutrient coverage varies by food, and iodine sits in a separate USDA database |
MyFitnessPal (free tier) | Food and calorie logging, built around calories and macros | Large, mostly user-submitted | Only as custom food entries | Shows few micronutrients; barcode scanning moved to Premium in 2022 |
Returns DRI reference values from your age, sex, height, weight and activity level | None | No logging | Reference values only; you still need something to log against them | |
Food and supplement logging, with coverage against a personal target for 25 micronutrients | USDA FoodData Central-backed | Yes; supplement content is AI-estimated | Photo logging and historical data are premium ($9.99/mo) |
A tracker's totals can be no better than its database, so missing nutrient values for a food show up as low numbers that look like real data. The structural gap to check first is whether the tool counts supplements at all. If it doesn't, every nutrient you supplement will read lower than what you actually take in.
What is Micros, and how is it different from a food-only tracker?

Micros adds your food and your logged supplements into one daily total for each nutrient. Each row shows the food versus supplement split, so you can see whether your magnesium comes from dinner or from a capsule. Targets start from DRI values (the RDA, or the AI where no RDA exists), adjusted for age and sex. The product calls these "targets" and "baselines" and does not label anyone deficient. Coverage sits next to lab upload and biomarker analysis, qualitative check-ins, protocol and cycle tracking, and Apple Health sync. One limit matters here: supplement nutrient content is estimated from the product and dose, and lab verifications can vary. Micros runs on the web and on iOS.
How do you track micros in Micros, step by step?

Fill in your health profile. Enter age, sex, height, weight and activity level. Age and sex adjust the micronutrient targets, and the rest personalizes energy and protein.
Log a meal. Describe it in plain text, such as "2 eggs, toast with butter, and a glass of orange juice," snap a picture, or search the food database. .
Confirm foods and portions. Every parsed or photographed meal goes through a review step before it counts. Portion size is the input the app can't check for you, so check it here.
Add your supplements. Log each product and dose so they count toward the daily totals. A 5000 IU D3 dose shows up as 125 mcg in the vitamin D row, labeled as supplement.
Read the coverage view. Green means 80% or more of target, amber 40-79%, and coral under 40%. Sodium is a limit nutrient, so the colors read the other way.
Compare weeks and labs. The "This week" trends view shows averages across days. Uploaded labs sit in the same app, and the AI chat can see nutrition totals alongside supplements, labs and check-ins, so you can see how they line up over time.
The iOS app is on the App Store. For background on individual nutrients, see the guides to vitamin D, vitamin B12 and magnesium. For reading the lab side, see what blood work numbers mean for people running protocols.
Where does micronutrient tracking go wrong?

Database gaps come first. Not every food entry carries a value for every nutrient, and a missing value reads as zero. Iodine is the clearest case: USDA, FDA and NIH publish it in a separate iodine database covering a few hundred common foods, so a tracker built on standard food records can show low iodine for someone eating plenty of it. Portion estimation adds error to every logged meal. Single days are noisy too. In a year-long study of 29 adults who recorded everything they ate, it took an average of 31 days of records to estimate one person's usual energy intake within 10%, and an average of 433 days for vitamin A (PMID 3655942). A weekly or monthly average says far more than any one day. Researchers name these limits themselves. The soccer study above used a 3-day food record from a single team of 19 players, and its authors list the short record and small sample as limitations (PMID 29037118).
The larger limit is that intake is not status. The soccer data measured intake only, with no biomarkers (PMID 29037118). Status is what labs measure. For B12, one review describes CBC and serum B12, with methylmalonic acid used to confirm deficiency in asymptomatic high-risk patients with low-normal B12 (PMID 28925645). Another notes that MMA and homocysteine can detect early deficiency when serum B12 is borderline (PMID 35491956). Higher is also not automatically better: high serum B12 has been associated with renal and liver disease and some cancers (PMID 36669740). One way to test your own tracking is to set a two-week coverage average beside your next lab report. Note which nutrients agree between the two and which do not. Then bring the mismatches to a clinician, along with your logged medications. Which of your green rows would hold up against a lab value?