
Most recovery failures do not arrive with a warning. The session that finally breaks a training block rarely explains itself. What shows up instead is a string of small signals: elevated resting...
Training Recovery Biomarkers: What to Measure, When to Test, and How to Connect the Dots
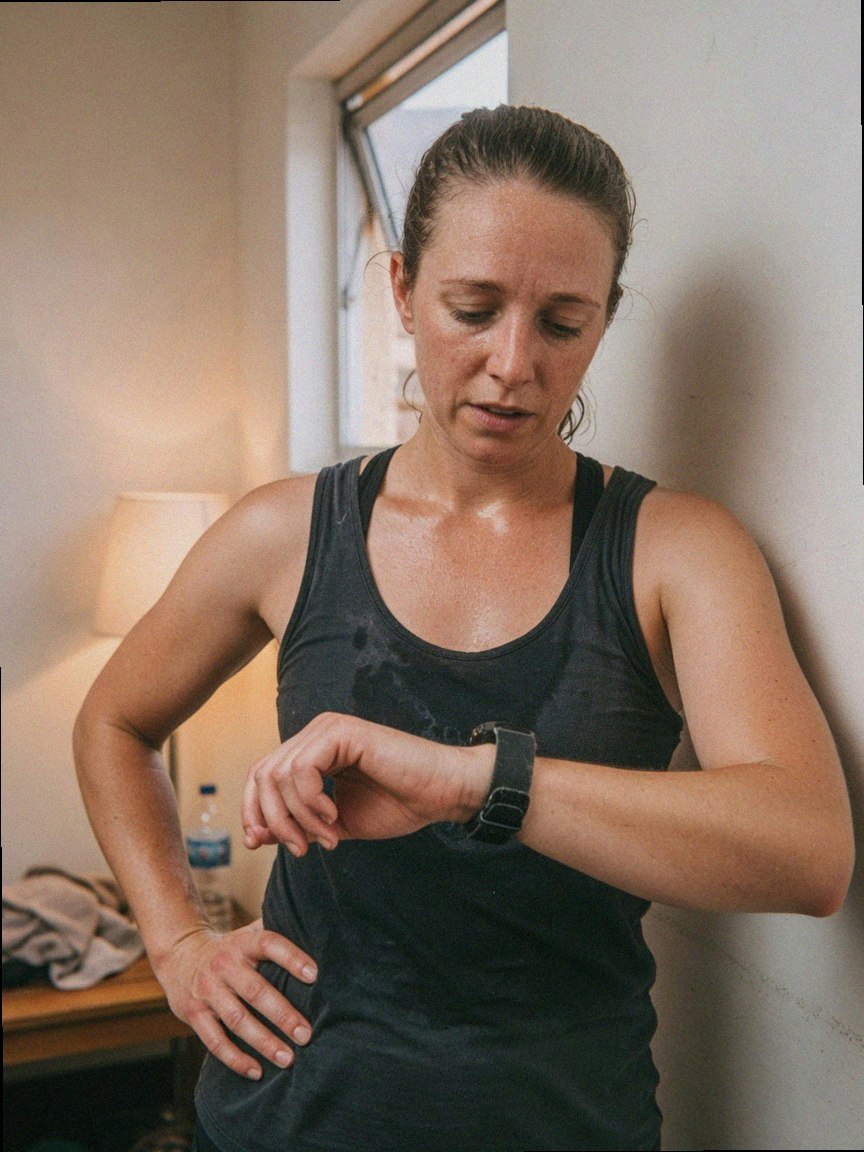
Athlete checking a smartwatch after training.
Most recovery failures do not arrive with a warning. The session that finally breaks a training block rarely explains itself. What shows up instead is a string of small signals: elevated resting heart rate for three days running, a performance plateau that should not exist given the work you have put in, or an illness that arrives right when you finally had a deload scheduled.
By the time performance drops, the underlying physiology has usually been moving in the wrong direction for days. The problem is that subjective readiness, your sense of whether you can train hard today, often lags behind what the relevant markers are actually doing.
This article covers the biomarkers most useful for training recovery, how to read them individually, how they interact, and how to build a testing cadence that gives you enough signal to make better decisions without turning recovery monitoring into a part-time job.
Why Subjective Readiness Is Not Enough on Its Own
Perceived readiness blends a lot of inputs into a single feeling. Motivation, sleep debt, caffeine timing, ambient stress, and circadian phase all contribute. The result is a signal that is real but imprecise. You can feel ready while ferritin is tanked, feel destroyed after a week of good adaptation, or feel flat because of poor sleep rather than genuine physiological fatigue.
Biomarkers do not replace that intuition. They add specificity. Inflammation, iron availability, autonomic tone, and stress axis balance can each shift meaningfully before the performance signal appears. Catching that shift earlier means you can adjust volume, recovery inputs, or testing cadence before you are forced into a reactive deload.
The goal is not to become a data machine. The goal is to know which markers move first in your own system, so you can intervene earlier and with more precision.
hs-CRP: Tracking Inflammatory Load Between Sessions
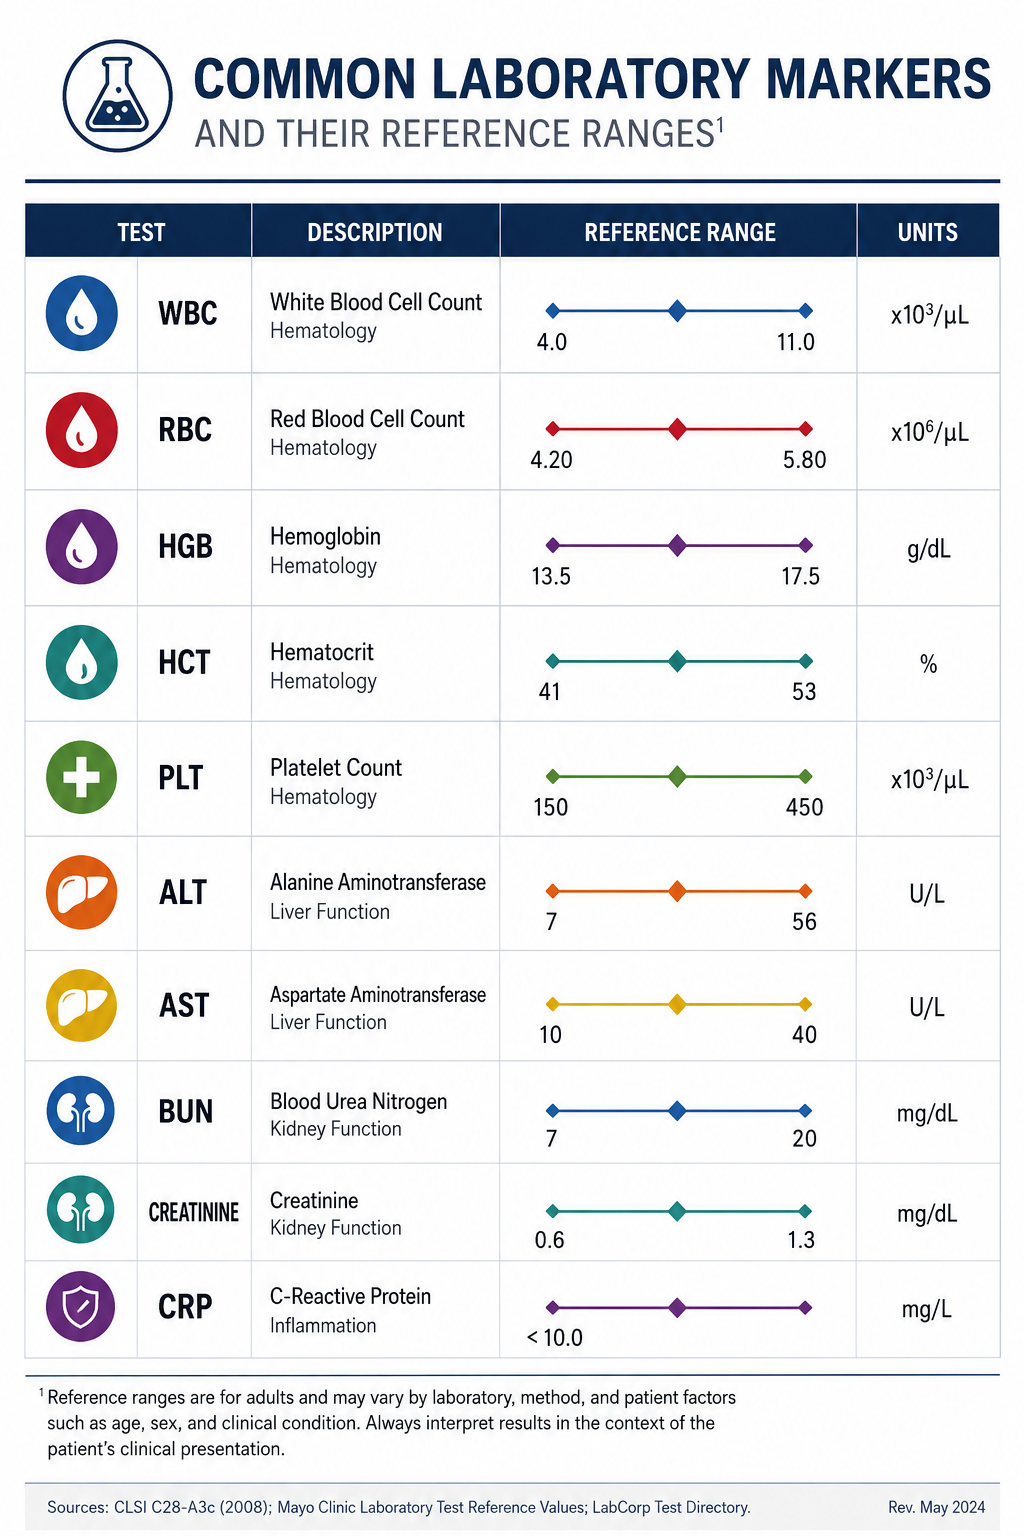
Standard CRP is useful for detecting infection or injury. For training recovery, you want high-sensitivity CRP, hs-CRP, because it resolves the lower range where exercise-induced inflammation lives.
Hard resistance or high-volume endurance sessions can raise hs-CRP within 24 to 48 hours. In a well-structured block with adequate recovery, it should trend back toward baseline before the next hard session. When it does not, inflammatory load is accumulating faster than it is resolving.
Practical reference points:
Below 1.0 mg/L on a rest day generally suggests manageable inflammatory burden
1.0 to 2.0 mg/L warrants attention in context of recent training volume
Above 2.0 mg/L on a rest day, especially if the elevation persists across multiple tests, is a signal to examine load, sleep, or the possibility of a subclinical illness
One test tells you almost nothing. hs-CRP responds to poor sleep, alcohol, minor infections, and rough nutrition patterns, not just training. Three tests taken over a few weeks under consistent conditions (morning, fasted, rest day when possible) give you a trend. The trend is what matters.
If hs-CRP keeps climbing while sleep and nutrition are stable and training load has not changed dramatically, that is a meaningful signal. If it stays low during a high-volume block, that tells you something useful about your current recovery capacity too.
Morning Cortisol and DHEA-S: Reading the Stress Axis

Cortisol is a functional hormone. It mobilizes energy, supports immune response, and helps the body handle training stress. The problem is not cortisol itself. The problem is when the normal morning peak becomes blunted, when the daily decline flattens, or when the system stays in a sustained stress state for long enough that other markers start to shift.
A random cortisol draw is not very informative. For recovery monitoring, the useful sample is a morning draw taken consistently within 30 minutes of waking, before food, caffeine, or significant movement. Timing variability will add noise that makes interpretation harder.
The more useful approach is to look at cortisol alongside DHEA-S. DHEA-S is a longer-lived adrenal hormone that functions as a counterbalance to cortisol. When training stress and life stress accumulate without adequate recovery, cortisol may stay elevated or lose its normal diurnal pattern while DHEA-S drifts lower. That shift can precede noticeable drops in drive, sleep quality, or training aggression by days or weeks.
What to watch:
Morning cortisol in the 10 to 20 µg/dL range is typical for healthy adults, though individual variation is real
A high cortisol-to-DHEA-S ratio, even when both values fall within normal reference ranges, can indicate sustained allostatic load
A blunted or absent morning cortisol response, sometimes called hypocortisolism, can appear after prolonged overreaching and may feel different from high-cortisol states, lower motivation, flat energy, reduced stress tolerance
When this pattern shows up, the answer is rarely to stop training entirely. More often it means pulling back on maximal intensity work, keeping total volume moderate, and ensuring protein and carbohydrate intake are not being restricted while recovery is already compromised. Adding stress on top of stress does not resolve the pattern.
Ferritin and Hemoglobin: The Recovery Bottleneck That Hides in Plain Sight
Iron status is one of the most commonly missed recovery variables. The reason is that ferritin, the storage form of iron, can decline for months before hemoglobin drops enough to register on a standard panel. By the time anemia shows up, iron depletion has usually been affecting performance for a while.
What low ferritin looks like in training:
Heart rate elevated relative to effort, especially during warm-ups
Flat performance on intervals or any work that taxes the aerobic system
Normal motivation and mental readiness but a physical ceiling that should not be there
Reduced adaptation despite consistent work
For athletes and people training at meaningful volume, ferritin below 30 ng/mL is often a functional problem even when hemoglobin is still in range. Many people perform better with ferritin above 40 to 50 ng/mL. The right target depends on individual history, training type, and baseline, but the key point is that the standard clinical cutoff for deficiency is not the same as the threshold for performance.
A few protocol considerations worth knowing:
Iron supplementation should be based on confirmed low ferritin, not guesswork. Iron overload is a real risk and not trivial to reverse.
Ferrous bisglycinate is generally better tolerated than ferrous sulfate and may cause less GI disruption.
Hepcidin, the hormone that regulates iron absorption, rises for several hours after intense exercise. Taking iron immediately post-workout may reduce absorption. Morning dosing on rest days or low-intensity days tends to work better.
Vitamin C taken alongside iron can improve non-heme absorption. Calcium and high-tannin foods taken at the same time can reduce it.
This is also a marker where a deload alone will not fix the problem. If ferritin is the issue, you need to address iron status directly. That is what makes it worth testing rather than assuming the issue is just training load.
HRV and Resting Heart Rate: The Autonomic Readout
Heart rate variability is the most accessible real-time recovery signal for most people. Higher HRV generally reflects greater parasympathetic tone and more recovery reserve. Lower HRV reflects sympathetic dominance, incomplete recovery, or another stressor depressing the system, whether that stressor is training, alcohol, poor sleep, illness, or psychological load.
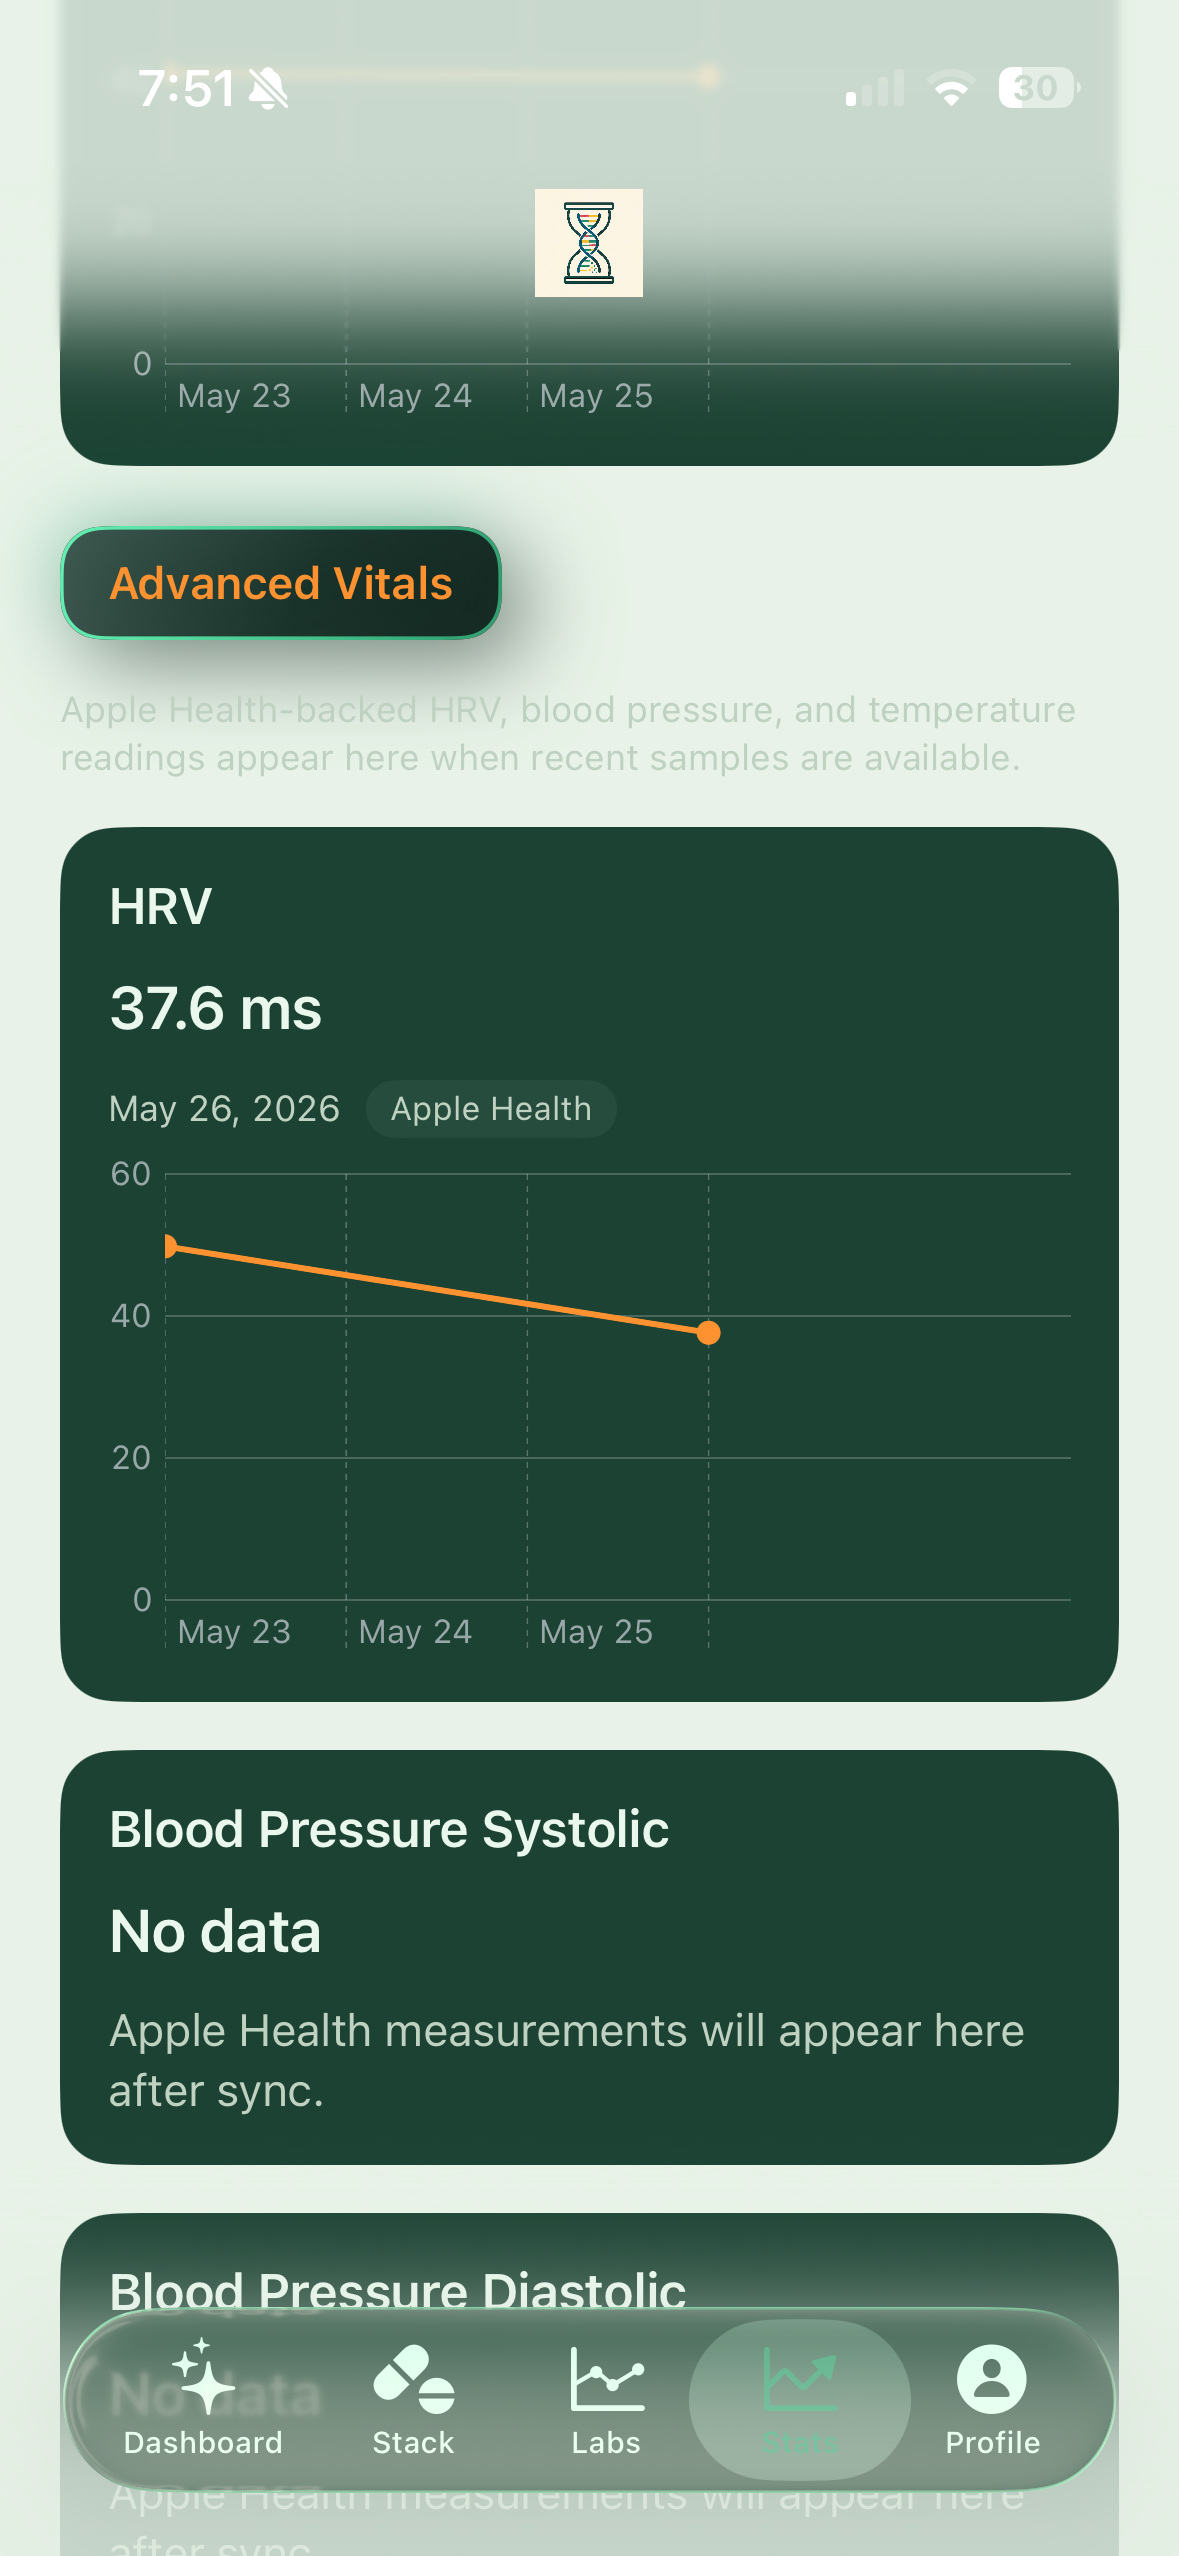
Resting heart rate adds context. HRV alone is noisy. RHR alone is noisy. Together, they are more interpretable.
A pattern worth acting on:
HRV down more than 8 to 10 percent from your personal baseline
RHR elevated 4 to 6 beats per minute above your baseline
Both trends persisting for several consecutive days
A single bad reading is not meaningful. A 7 to 14 day rolling average is far more useful than any individual morning score. The day-to-day variation is real and expected. The trend across a week is where the signal lives.
The important caveat is that HRV responds to everything. One late meal, one night of disrupted sleep, one stressful afternoon, or two drinks can all suppress the next morning's reading. That is not a flaw in the metric. It is the metric doing its job. The challenge is having enough context to interpret what you are seeing, which is exactly where logging inputs alongside wearable data becomes useful.
When you can see that your HRV baseline was lower during weeks when post-workout carbohydrate was restricted, or that your RHR pattern improved consistently after adding magnesium glycinate before bed, you are getting actual feedback from your protocol rather than just collecting numbers.
How the Markers Interact
Single markers give you fragments. Combinations give you a more complete picture.
Elevated hs-CRP alongside suppressed HRV
This combination suggests simultaneous inflammatory load and autonomic strain. Both systems are signaling that recovery is incomplete. If this pattern shows up mid-block, the training plan needs adjustment, not just one more rest day.
High cortisol-to-DHEA-S ratio alongside declining HRV trend
This pattern often points to sustained allostatic load, particularly when training stress and non-training stress are both elevated at the same time. In this case, recovery quality (sleep architecture, nutrition adequacy, psychological deload) usually matters more than simply cutting training days.
Low ferritin alongside suppressed HRV
This can look almost identical to overreaching. The performance ceiling, the flat HRV, the poor adaptation all match. But the fix is different. If ferritin is the driver, reducing training load will not restore performance. Distinguishing between the two requires actually testing ferritin.
Normal hs-CRP alongside poor HRV and poor subjective scores
When inflammation markers are unremarkable but HRV and subjective readiness are both down, the picture often looks more like central fatigue or accumulated psychological stress than tissue damage. In that case, changing training modality, reducing cognitive complexity in sessions, or pulling back from high CNS-demand work may help more than cutting volume alone.
The Subjective Layer and Why It Belongs in the Same System
Biomarkers tell you what the system is doing. They do not tell you why, and they do not capture everything relevant.
Two athletes can show similar HRV and hs-CRP values and recover at very different rates because one is undereating, one is sleeping six hours, and one is carrying significant psychological stress. The biomarker data does not contain that information. Daily check-ins do.
Keep the check-in simple and consistent:
Sleep quality
Muscle soreness
Energy level
Motivation to train
Joint or connective tissue pain
A 1 to 10 scale logged every morning takes less than a minute. The value accumulates over weeks. You start to see the lag: maybe your motivation drops two days before HRV does, maybe soreness resolves before hs-CRP does, maybe your energy score is the first thing to recover after a deload. Once you know your own pattern, you have an earlier warning system than any single marker provides.
If you want to connect supplement logs, lab uploads, wearable data, and daily check-ins in one place, Micros Tracker is built for that kind of feedback loop. The point is not to prove that a protocol is working. The point is to see how your inputs, labs, and subjective recovery data move together over time, so that patterns become visible across weeks and blocks rather than staying invisible until something goes wrong.
A Testing Cadence That Is Actually Sustainable
You do not need weekly labs to get useful information. Most people get more from fewer tests taken consistently than from frequent tests taken under variable conditions.
Every 4 to 6 weeks (or at the start and end of a training block)
hs-CRP
Ferritin and hemoglobin
Morning cortisol and DHEA-S
Full blood count
Take blood in the morning, fasted, and on a rest day when possible. Keep the conditions consistent across tests so that changes in the numbers reflect physiology rather than testing variability.
Weekly
HRV rolling average from your wearable
Resting heart rate trend
Use the trend, not individual readings.
Daily
Sleep quality, soreness, energy, motivation (brief check-in, consistent scale)
This is the layer that helps explain what the lab and wearable data are showing. It is also the layer that catches things the other two miss.
When you change a supplement, note the dose and start date. If you switch from magnesium oxide to magnesium glycinate, give it two to three weeks and then look at whether sleep quality, HRV, or morning readiness actually shifted. If nothing moves, that is useful data. If something does move, you have a cleaner basis for keeping it in the protocol.
Where to Start
Pick one marker you are not currently tracking.
If you have lab access, add hs-CRP and ferritin to your next panel. If you rely on wearables, log HRV and resting heart rate every morning for 14 consecutive days and add one daily subjective score for energy or soreness alongside it.
Then look for the lag. How many days does it take for your subjective readiness to catch up to what HRV is showing? Does hs-CRP normalize before soreness does, or after? Does your ferritin trend explain a performance plateau that seemed otherwise mysterious?
The goal is to map your own pattern, not to match someone else's recovery profile. Once you know which marker moves first in your system, and how long the lag is between biomarker shifts and subjective changes, you can make better decisions about when to push, when to pull back, and when the problem is actually something you need to address in the lab rather than in the training plan.