
The popular rule says each extra 1,000 IU/day of D3 adds about 10 ng/mL to 25(OH)D, and a retest four to six weeks later shows where you've landed. The trials tell a messier story: wide spread on the same dose, body size changing the slope, and levels still climbing months later.
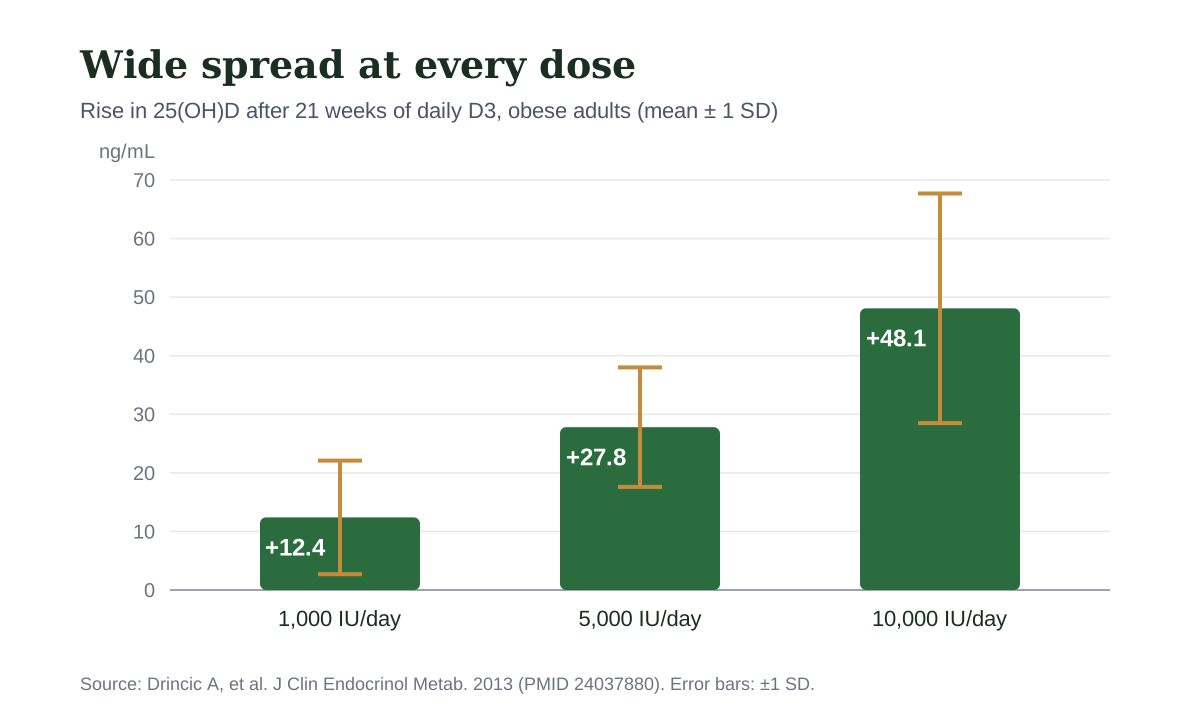
You have probably heard the rule that every extra 1,000 IU/day of D3 raises 25(OH)D by about 10 ng/mL, and that a retest four to six weeks later shows where you've landed. In a randomized trial of 67 obese adults, the 1,000 IU/day arm gained 12.4 ± 9.7 ng/mL after 21 weeks over winter (PMID 24037880). The standard deviation is nearly as large as the mean. People on the identical dose, in the same arm of the same trial, ended up with very different results.
What do the trials show 1,000 to 4,000 IU/day does to 25(OH)D?
Here is what the available trials measured, in the units each one reported:
Trial | Population | Baseline 25(OH)D | Dose (D3) | Duration | Rise |
|---|---|---|---|---|---|
GAPI (PMID 24092833) | 323 children aged 9-13, US 34°N and 40°N, winter | 70.0 nmol/L mean | 0 to 4,000 IU/day | 12 weeks | -10 nmol/L (placebo) to +76 nmol/L (4,000 IU) |
Obese adults (PMID 24037880) | 67 obese adults, winter | not stated in abstract | 1,000 / 5,000 / 10,000 IU/day | 21 weeks | +12.4 / +27.8 / +48.1 ng/mL |
Dialysis (PMID 22798536) | Stage 5 CKD on hemodialysis | 13.3 ng/mL median | ~1,476 IU/day (10,333 IU weekly) | 15 weeks | +23.6 ng/mL (IQR 19.2-29.9) |
STURDY (PMID 33284677) | 688 adults ≥70 at high fall risk, baseline 10-29 ng/mL | 55.3 nmol/L mean | 200 (control) / 1,000 / 2,000 / 4,000 IU/day | 3 months shown (follow-up to 24 months) | Mean level at 3 months: 67.1 / 80.3 / 87.3 / 119.2 nmol/L |
How much do body size and population change the rise?
You can still make a planning estimate. The obese-adult trial found that the response was directly related to dose and body size, with roughly 2.5 IU/kg required per 1 ng/mL increment (PMID 24037880). Take a 90 kg person whose logged dose goes from 2,000 to 4,000 IU/day. The extra 2,000 IU divided by (2.5 × 90) comes to about +9 ng/mL at steady state. A 65 kg person making the same change would come out closer to +12. This coefficient was derived in obese adults, so for a lean body it is an extrapolation. Body size sets the slope, and a fixed per-1,000 IU number hides that.
Ancestry and population also shift the result. In GAPI, white children gained significantly more 25(OH)D than Black children at the highest dose (P < .01) (PMID 24092833). Within each GAPI group, the response still scaled with dose. However, the same dose did not produce the same blood level across groups. Treat the +9 as a rough figure to compare a lab result against, and expect the real number to land somewhere around it.
How long does 25(OH)D take to approach steady state?
Neither half of the rule holds up against the trial data, and the timing half fails more clearly than the dose half. The obese-adult trial modeled the plateau each arm would eventually reach, which can be compared with what was measured at week 21:
Dose (D3) | Measured rise at week 21 | Modeled steady-state rise |
|---|---|---|
1,000 IU/day | 12.4 ng/mL | 20.6 ng/mL |
5,000 IU/day | 27.8 ng/mL | 35.2 ng/mL |
10,000 IU/day | 48.1 ng/mL | 51.3 ng/mL |
The gap narrows as the dose goes up. At 1,000 IU/day, after about five months, these participants had covered only around 60% of their projected rise (PMID 24037880).
The other trials measured on similar timelines. GAPI drew blood at 6 and 12 weeks (PMID 26885880). The dialysis trial reported reaching steady state within 15 weeks (PMID 22798536). STURDY measured at 3, 12 and 24 months (PMID 35399053). None of these trials suggests 25(OH)D has settled by 4-6 weeks. A retest at that point catches the level while it is still rising. The lower the dose, the longer the climb lasts in these data, so a modest change, such as going from 1,000 to 2,000 IU, may still be moving at the four-month mark.
What should you log so a retest result means something?
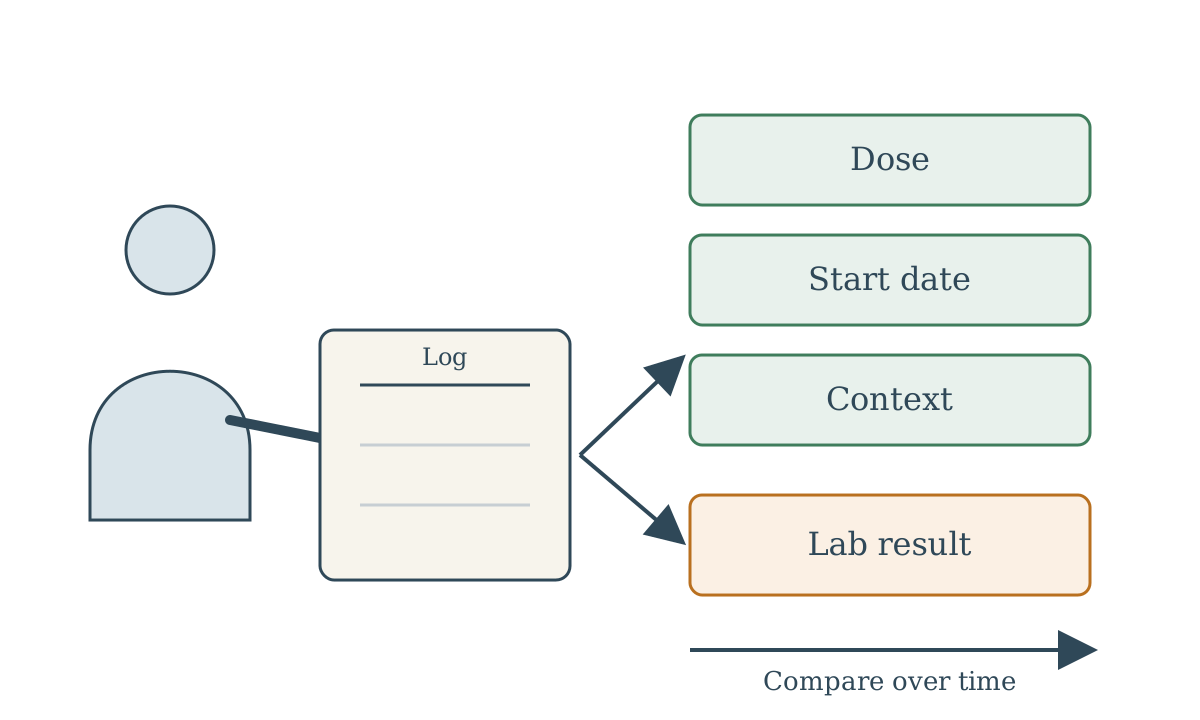
A retest only means something if you can compare it with what you were actually taking and when. These are the details worth logging:
Baseline draw date and season. GAPI and the obese-adult trial both started in winter, near the seasonal low. A summer baseline followed by a winter retest mixes the effect of the sun with the effect of the dose.
Dose changes, and nothing else new. Log the D3 dose, brand and timing, and note any other new inputs that start during the same window.
Weeks between the dose start and each draw. Compare that interval with the trial windows: 6 and 12 weeks in GAPI, within 15 weeks in the dialysis trial, and 21 weeks in obese adults who still sat below modeled steady state.
Lab name and assay for every result. Different methods can disagree. When researchers ran the same 204 samples through three methods, mean 25(OH)D came out at 85 nmol/L by mass spectrometry, 70 by radioimmunoassay and 60 by a chemiluminescent immunoassay (PMID 20644628). The trials above used different methods too: radioimmunoassay in GAPI, LC-MS/MS in STURDY (PMID 24092833; PMID 33284677).
Dose, start date, draw date and lab name together, so each result sits next to its context.
Micros lets you log your D3 dose and upload your lab results to the same account. Your 25(OH)D results plot over time on the biomarker chart, and the AI assistant can see both your supplement log and your labs, so when a retest comes back you can ask it how long you had been on that dose. For background on forms and dosing, see the vitamin D guide.
Does a higher 25(OH)D mean anything else changed?
A higher 25(OH)D does not show that anything else in your body changed. In GAPI, the rise in 1,25(OH)2D was not significant (P = .07). PTH fell, but the decrease did not scale with dose. Dose had no effect on fractional calcium absorption after adjustment (PMID 24092833). In the same cohort, glucose, insulin and HOMA-IR all rose over 12 weeks even as 25(OH)D climbed in a dose-dependent way (PMID 26885880). In STURDY's ancillary study, 1,000+ IU/day did not change hs-cTnI or NT-proBNP over 24 months compared with 200 IU/day (PMID 39850664). Your 25(OH)D result measures how much vitamin D is in your blood. To learn whether that level is doing anything, you have to track a separate outcome.
A higher dose also carried some risk in one trial. In STURDY, adults aged 70 and older at high fall risk were randomized against a 200 IU/day control. The apparent drop in outdoor falls at 1,000 IU (HR 0.61) and 2,000 IU (HR 0.60) did not hold up after adjustment for multiple comparisons (adjusted p = 0.222). Meanwhile, the pooled ≥1,000 IU/day group had a higher risk of fall-related fracture (HR 2.66; 95% CI 1.18-6.00) (PMID 34118059). This finding applies to older adults at high fall risk, and it does not transfer directly to a 35-year-old lifter. It does weaken the assumption that raising the number is harmless.
Write down the 25(OH)D level you are aiming for and where that target came from. Then decide which outcome, besides the lab number, would convince you that reaching it made a difference, and bring that question to your clinician.