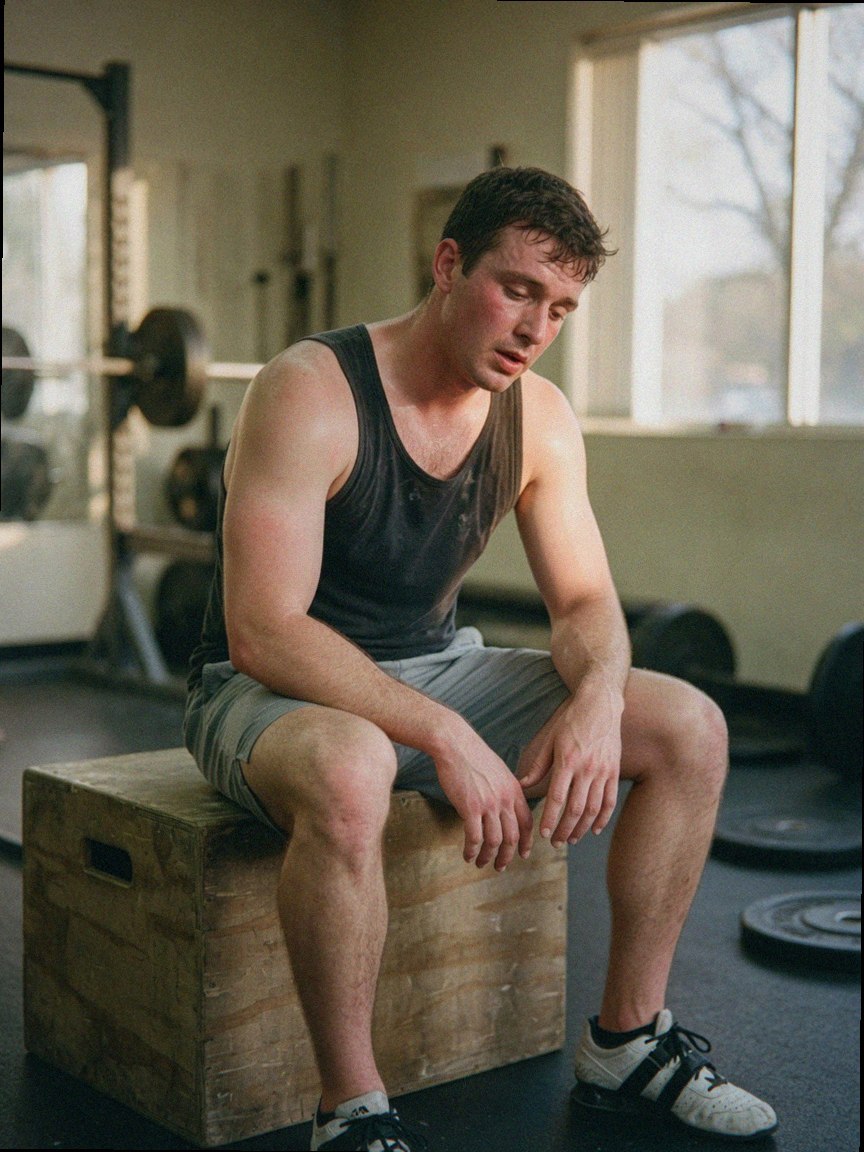
Your quads are wrecked on Wednesday. You have a squat session scheduled Thursday. Do you push, modify, or pull the plug?
Soreness Is One Signal. Readiness Is the Decision
Your quads are wrecked on Wednesday. You have a squat session scheduled Thursday. Do you push, modify, or pull the plug?
If soreness is the only input you have, you are making a systemic decision with a local measurement. DOMS reflects microtrauma and the inflammatory response around it, mostly in the tissue that absorbed the stress. The real question is broader: has your autonomic system recovered, is glycogen back, can your nervous system still produce force, and do you have enough overall capacity to train well?
Soreness and readiness often track together loosely, then diverge during high-volume blocks, travel, illness, poor sleep, or any stretch where central fatigue accumulates faster than peripheral soreness resolves.
The practical fix is a signal stack where soreness is one variable, not the decision rule.
What Soreness Actually Measures
Delayed onset muscle soreness usually peaks 24 to 72 hours after exercise. It reflects microtrauma, inflammatory signaling, and sensitization of muscle nociceptors. In plain terms, it tells you which tissue took stress and how much of a local inflammatory response followed.
What it does not tell you is whether you are systemically recovered. It does not capture autonomic state, sleep-dependent repair, glycogen status, or whether your nervous system is still producing force normally.
That is why soreness works better as context than as a go or no-go rule.
The Signals Worth Tracking
Heart Rate Variability
HRV, usually measured as RMSSD by consumer wearables, reflects autonomic balance. Higher variability generally lines up with a more recovered state, while lower variability often shows up with hard training, poor sleep, alcohol, illness, and accumulated stress.
The key is trend, not a single morning reading. A sustained drop across several mornings is more useful than one bad night. A 10 to 15 percent suppression from your normal range is worth paying attention to, especially if it persists for three days or more after a hard block.
If you already use a wearable, syncing Apple Health data makes this much easier to review in context instead of checking one-off readings in isolation.
Resting Heart Rate
Resting heart rate tends to drift upward during incomplete recovery, overreaching, and illness. A sustained increase of 5 to 10 beats per minute above your baseline is a useful warning sign, especially when it appears alongside low HRV or poor sleep.
Again, the baseline matters more than a universal cutoff. Your normal is the reference point.
Grip Strength
A handheld dynamometer gives you a fast proxy for neuromuscular readiness. Grip strength can drop when fatigue is systemic, and some coaches use it because it is simple, cheap, and repeatable.
Keep the protocol consistent, dominant hand, standing, elbow at 90 degrees, same time each morning before caffeine. Record the best of three maximal attempts. A decline of around 5 percent from your rolling average is worth noticing, especially if it matches low HRV or a bad warm-up.
It will not tell you everything, but it often tells you enough to avoid guessing.
Subjective Readiness Score
A 1 to 10 readiness score becomes much more useful when you anchor it.
- 3 means flat, unmotivated, and warm-ups feel heavy
- 5 means normal but not great
- 7 means ready, nothing unusual
- 9 means primed and ready to train hard
Without anchors, the scale drifts. With anchors, it starts to show patterns. Maybe readiness improves after a rest day. Maybe it tanks after late caffeine, alcohol, or a stressful workday. That is useful because it gives you something to change.
Training Load
Log what you actually did. Session duration, total volume load, and RPE on working sets matter because recovery signals only make sense in context.
A low-HRV morning after a 90-minute high-volume lower body session means something different than the same reading after a moderate upper body day. Without the training context, recovery data is easy to misread.
Biomarkers for the Slower Picture
Daily metrics capture short-term fluctuations. Labs give you the slower structural picture underneath.
Creatine Kinase
CK reflects cumulative muscle damage. Reference ranges vary by training history, sex, and genetics, so trend matters more than any single value. If CK stays elevated across a hard block and performance is slipping, that suggests damage is outpacing repair.
This is a checkpoint metric, not a daily one. Testing at the start of a block, mid-block, and at deload gives you a useful arc.
Ferritin
Ferritin is worth watching because low levels can impair oxygen transport and energy production before you feel obviously off. In active people, fatigue and performance issues can show up when ferritin is technically normal but still low relative to demand.
If readiness metrics are persistently suppressed and training load does not fully explain it, ferritin is one of the first labs to check. In practice, the number matters less than whether it fits the rest of the picture.
Testosterone and Cortisol
The testosterone-to-cortisol ratio is a rough way to look at the anabolic-catabolic balance across a training cycle. Neither hormone alone says much. The trend over time, especially across distinct blocks, is more informative than one lab panel.
If you test, keep the timing consistent, same time of morning, same phase of your training cycle, same general conditions.
Vitamin D
25-hydroxyvitamin D is easy to overlook. Levels below 30 ng/mL are common in winter or with limited sun exposure, and low status has been associated with poorer muscle function and immune resilience in some research.
If you have not checked it recently and spend most of the day indoors, it is worth pulling. Retesting 8 to 12 weeks after a protocol change is more useful than assuming a dose is enough.
If you upload lab results into a system that lets you compare them against training history, the patterns are easier to spot than when they sit in isolated PDFs.
Supplements That Can Support Recovery
These compounds have some evidence and plausible mechanisms for recovery-related use. They do not replace sleep, calories, or sane training load.
Creatine Monohydrate
Creatine supports ATP regeneration and has evidence for reducing post-exercise CK elevation and blunting strength loss after eccentric loading. Five grams daily is the standard maintenance dose. Timing matters less than consistency.
One tracking detail matters here: creatine can raise baseline serum creatinine, which affects estimated GFR on metabolic panels. If you run creatine and pull kidney function labs, flag it for your clinician and interpret the panel in context. See the creatine guide for dosing and loading details.
Omega-3 Fatty Acids
EPA and DHA influence prostaglandin synthesis and cytokine signaling, which may reduce the inflammatory component of soreness. Studies using 2 to 4 grams of combined EPA and DHA daily have shown reductions in soreness severity and faster return of peak force output in some trials, with effects that seem more consistent in untrained or moderately trained people than in highly trained athletes.
From a tracking perspective, omega-3s can also shift your baseline a bit, including HRV in some people, so it is worth holding other variables steady when you add them. Quality matters too, so look for third-party testing and oxidation data, not vague marketing language. See the omega-3 guide.
Magnesium
Magnesium glycinate, or sometimes threonate, at 200 to 400 mg before bed is commonly used for sleep support. The mechanism runs through NMDA receptor modulation and GABA-related signaling.
Sleep is one of the biggest recovery levers you have, and its effect on HRV, resting heart rate, and next-morning readiness is large enough that it often swamps supplement effects. If you track sleep and readiness together, magnesium’s effect, if any, usually shows up within a couple of weeks of consistent use.
Protein Distribution
Total daily protein does most of the work. A practical target for active adults is 1.6 to 2.2 grams per kilogram of bodyweight per day, spread across 3 to 5 meals at roughly 0.4 grams per kilogram per meal.
The tracking angle is simple: do long overnight fasts, skipped post-training meals, or low-protein days line up with slower soreness resolution or worse readiness the next morning?
Reading the Interactions
The most common mistake in supplement and recovery tracking is treating each input as isolated.
Creatine saturation takes roughly three to four weeks at 5 grams daily. If you track CK during an early phase versus a saturated phase, you may see a different post-exercise response. That is not a confound, that is part of the signal.
Late caffeine, even at 200 mg six hours before sleep, can reduce sleep quality in some people. If readiness and HRV are mediocre despite an otherwise clean protocol, caffeine cutoff time is worth logging before blaming magnesium or protein timing.
If you add omega-3s and your HRV trend improves, you still need enough time and consistency to tell whether the change came from inflammation, sleep, or something else. The point is not to isolate every mechanism perfectly. The point is to make better decisions with the data you have.
Micros Tracker is built for this kind of layered log, supplement timing, qualitative check-ins, Apple Health metrics, and lab uploads in one place so correlations across weeks are visible instead of reconstructed from memory. The app does not tell you what caused what, but it surfaces patterns that are worth investigating.
A 10-Day Readiness Baseline
Run this before changing your training rules or supplement protocol.
Each morning, before caffeine
- Record HRV and resting heart rate from your wearable
- Test grip strength, dominant hand, standing, elbow at 90 degrees, three maximal attempts, record the peak
- Rate readiness on your anchored 1 to 10 scale
- Log sleep duration and one short sleep note, for example restless, solid, woke at 3 a.m.
After each session
- Record session duration, total volume load, and RPE
- Rate soreness by muscle group the following morning on the same anchored scale
- Note whether soreness changed your warm-up, range of motion, or performance
After 10 days, ask these questions
- Which signal, HRV, grip, readiness score, or soreness, most consistently predicted whether the session went well?
- Were there days where soreness was high but performance was fine?
- Were there days where you felt fine subjectively but output was clearly down?
- Did grip strength drop more than 5 percent before bad sessions?
- Did sleep, alcohol, late meals, or supplement timing show up before good or bad days?
That last part matters most. If your best sessions consistently follow eight hours of sleep and no alcohol, that is not trivia. It is a protocol decision. If grip strength drops before bad workouts, use it as a gatekeeper. If soreness is high but performance stays normal, stop treating soreness as the main decision rule.
Track the stack, the labs, and the training, then see what actually predicts output with Micros Tracker.